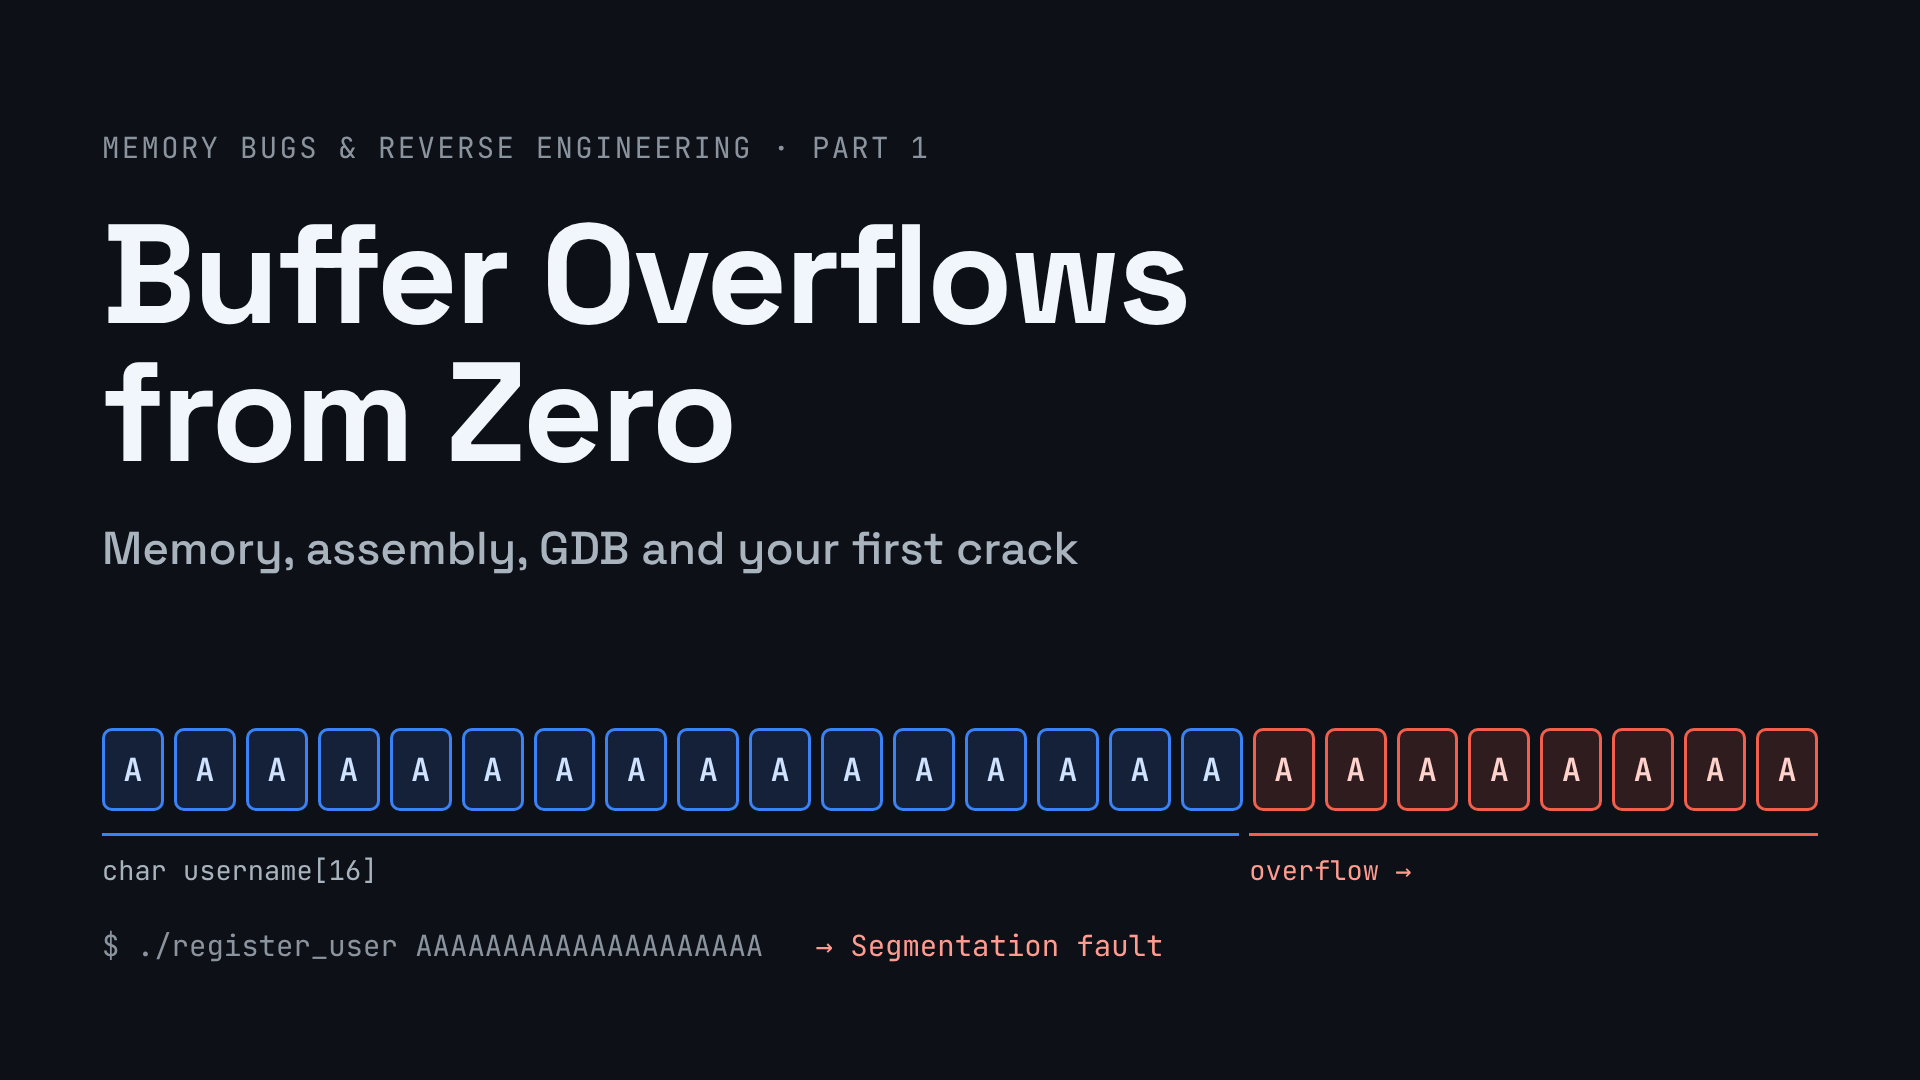
Buffer Overflows from Zero: Memory, Assembly, GDB and First Crack
A buffer overflow happens when a program writes more data into a memory box than the box can hold. The extra don't disapper, they land on whatever sits next to the box. In this post we'll make that happen on purpose, watch it in a debugger and then bend a second program to our will without knowing its password.
What is a buffer overflow?
A buffer is simply a reserved block of memory, for example space for 16 characters of a username. Programs use buffers all the time to hold data while they wotk with it.
The trouble starts when a programmer assumes the input will always be small enough. If the program copies the input into the buffer without checking its length, a longer input keeps writing past the end. Whatever lives next door in memory gets overwritten.
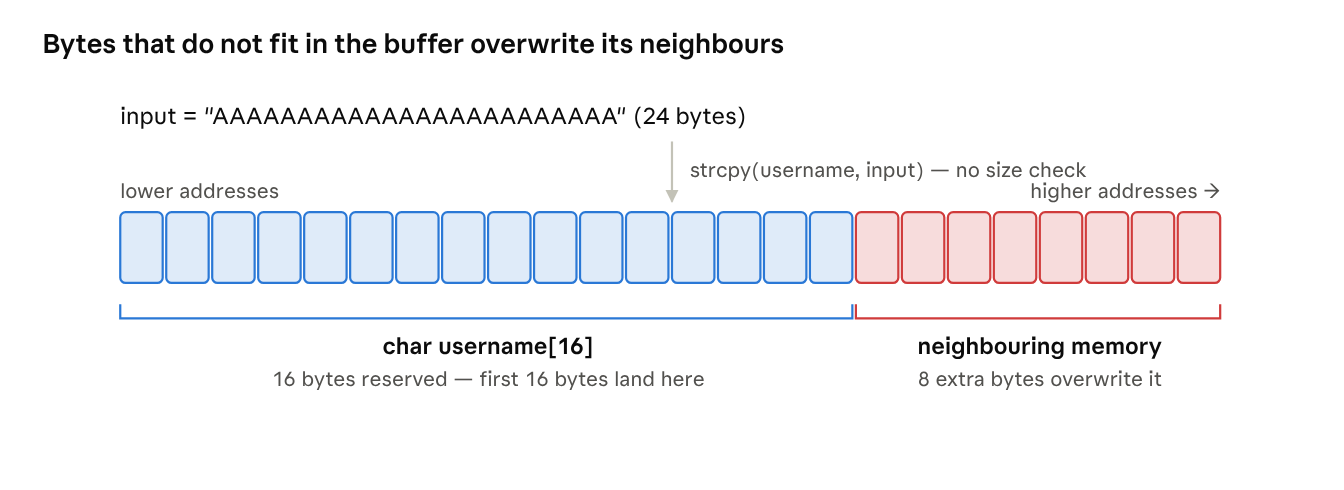
The check that is missing is called bounds checking, making sure an index or a length stays inside the allowed range before the data is used. In C, functions like strcpy(), gets() and sprintf() do no such check, which is they show up in so many vulnerabilities.
What happens next depends on what got overwritten:
- Other data → wrong results or strange program behaviour
- Internal pointer → the program reads or jumps to garbage addresses and crashes
- Carefully chosen values → an attacker controls what the program does next. This is where an overflow turns into an exploit.
Where it happens: stack vs heap
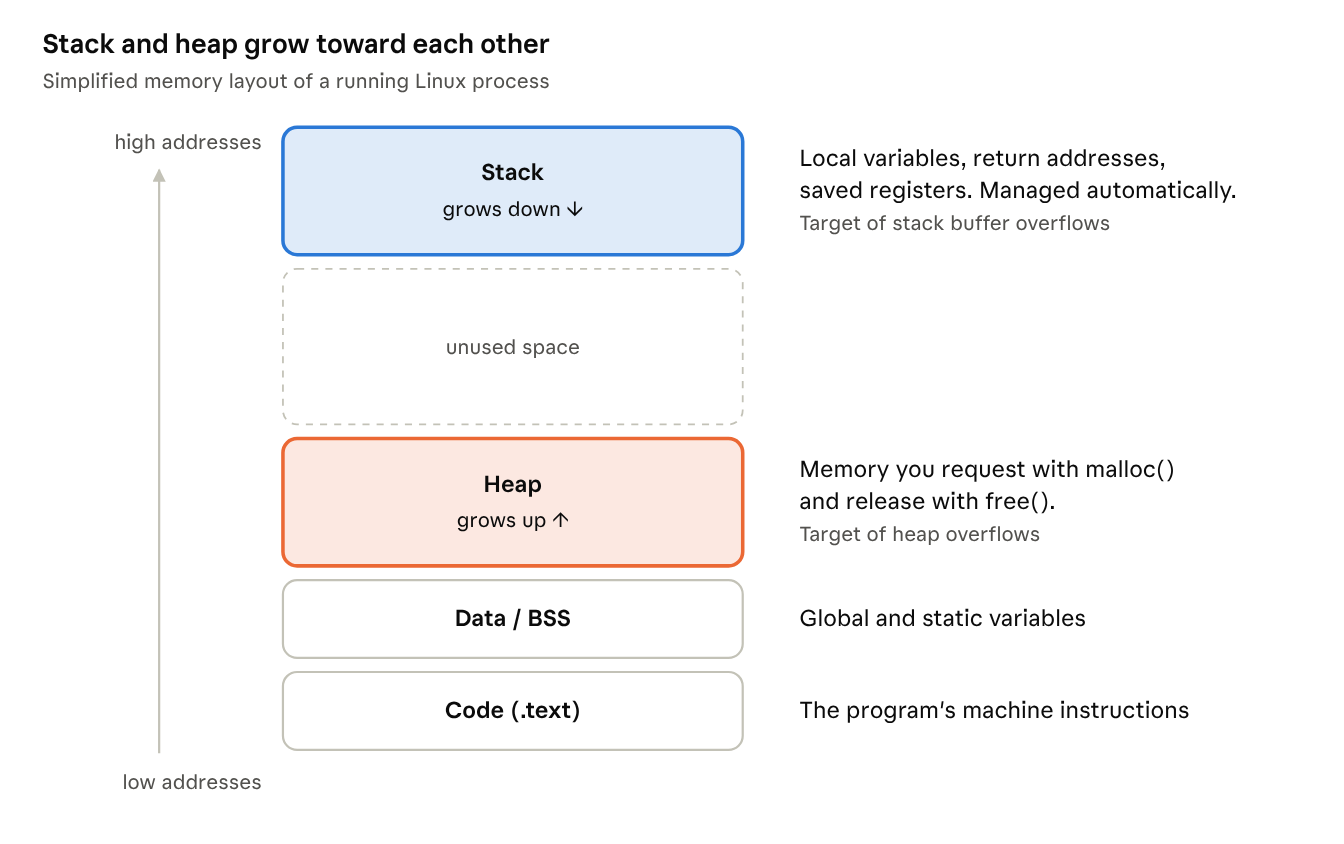
A running program keeps its data in two main areas, the stack and the heap. Overflows can happen in both, but they are exploited very diffently.
The stack
The stack is the program's short-term memory for function calls. Every time a function is called, a new stack frame is pushed on top. It holds the function's local variables and, crucially, the return address, where the CPU should continue once the function is done. When the function returns, its frame is popped off again. Last in, first out (LIFO), like a stack of plates.
You never free stack memory yourself, it grows and shrinks automatically. Its size is limited by the operating system. (Running out of it is a stack overflow, which is different bug from stack buffer overflow.)
A stack buffer overflow writes past a local buffer into the rest of the frame. Classic ways to abuse this:
- Overwrite the return address so that, when the function returns, the CPU jumps to code chosen by the attacker (shellcode).
- Overwrite a neighbouring local variable, for example an
is_adminflag. - Overwrite a function pointer that the program will call later.
- Overwrite a saved pointer of the calling function, so that the caller misbehaves after the return. We'll see exactly this in Lab 1.
The heap
The heap holds memory you request explicitly at runtime with malloc() and release with free(). It is larger than the stack, its data can outlive a single function call, and all threads of program share it (each thread has its own stack).
A heap overflow cannot overwrite a return address directly, because there is none on the heap. Instead, attacker corrupt the bookkeeping data that the memory allocator stores next to each block. When the allocator later uses those corrupted pointers, it can be tricked into writing an attacker-chosen exploitation therefore depends heavily on which allocator the system uses.
| Stack | Heap | |
| Who manages it | Compiler and CPU, automatically | The programmer (malloc/free) |
| Lifetime | Until the function returns | Until free() is called |
| Size | Small, fixed limit | Large |
| Shared between threads | No, one per thread | Yes |
| Typical overflow target | Return address, local variables | Allocator metadata, function pointer |
Assembly crash course
This is not a full assembly tutorial. It's the minimum you need to follow along when we open a program in a debugger.
Assembly is the human-readable form of machine code. One line usually equals one instruction the CPU executes. The CPU runs a simple loop forever, called the fetch-decode-execute cycle: fetch the next instruction from memory, figure out what it means, execute it, repeat.
Registers: the CPU's own variables
Registers are a small set of extremely fast storage slots inside the CPU. Almost every operation works on them. On a 64-bit CPU each generak register is 64 bits wide, and for historicak reasons you can address smaller parts of it by different names.
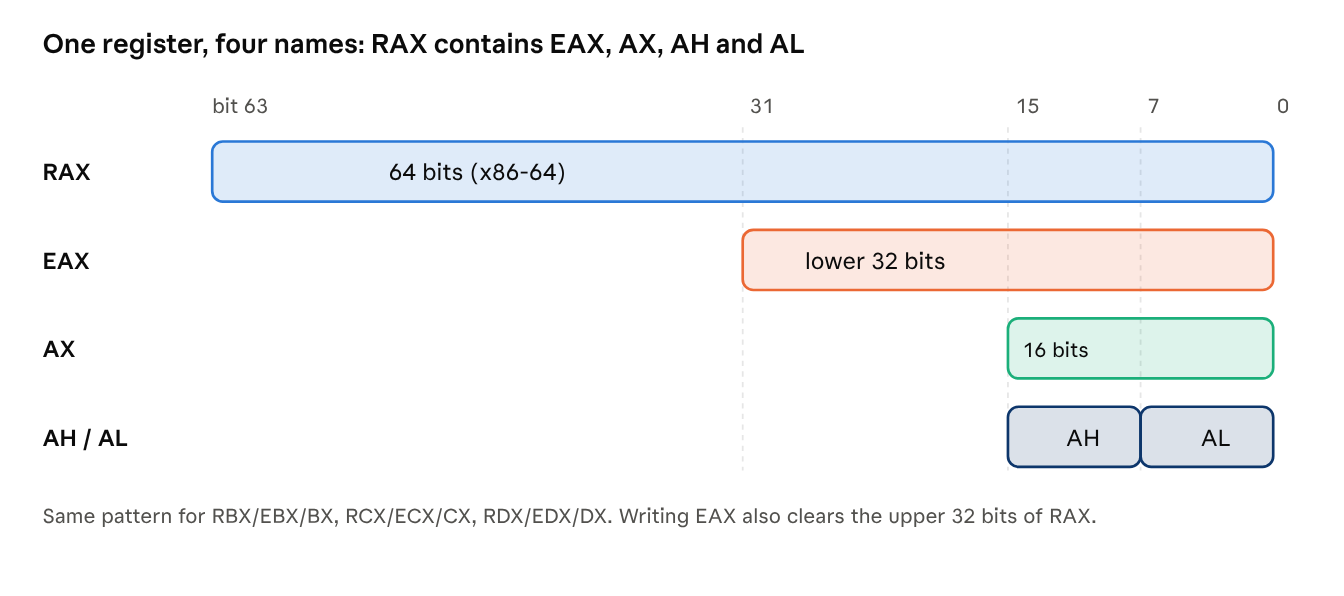
The register you'll meet most often in this series:
| 64-bit | 32-bit | What it's used for |
RAX |
EAX |
Arithmetic, holds a function's return value |
RDI, RSI, RDX, RCX, R8, R9 |
EDI, ESI, EDX, ECX, R8d, R9d |
The first six function arguments, in this order (Linux, System V convention) |
RSP |
ESP |
Stack pointer, the current top of the stack |
RBP |
EBP |
Base pointer, a fixed reference point inside the current stack frame. Locals are found at rbp-0x4, rbp-0x10 and so on |
RIP |
EIP |
Instruction pointer, address of the next instruction. Whoever controls RIP controls the program. |
RFLAGS |
EFLAGS |
Status flags set by comparisons and arithmetic |
Data sizes
| Name | Size | Seem om GDB as |
| byte | 1 byte (8 bits) | BYTE PTR |
| word | 2 bytes (16 bits) | WORD PTR |
| double word | 4 bytes (32 bits) | DWORD PTR |
| quad word | 8 bytes (64 bits) | QWORD PTR |
Byte order: little indian
The value 0x1337 need two bytes: 0x13 (the high byte) and 0x37 (the low byte). x86 CPUs store the low byte at the lower address. This is called little endian.
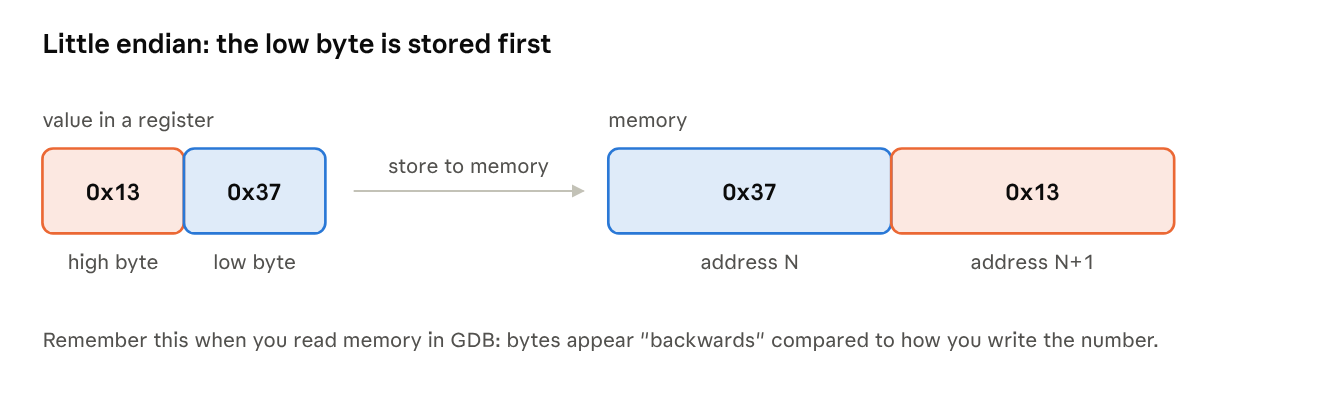
Reading an instruction
An assembly line looks like this (everything in brackets is optional):
[label:] mnmonic [operands] [; comment]
The mnemonic is the operation, the operands are what it works on. In Intel syntax (which we'll use in GDB) the destionation comes first:
mov rdi, 8                  ; put the number 8 into rdi
mov rdi, rsi                ; copy the value of rsi into rdi
mov rdi, QWORD PTR [rsi]    ; LOAD: treat rsi as an address, read 8 bytes from there into rdi
mov QWORD PTR [rsi], rdi    ; STORE: write the 8 bytes in rdi to the address in rsi
add rax, 0x8                ; rax = rax + 8
lea rax, [rbp-0x10]         ; put the ADDRESS rbp-0x10 into rax (no memory is read)
The square brackets are the key idea: rsi is avalue, [rsi] is the memory at the address stored in rsi. That is exactly how C pointers work under the hood.
Flags and decisions
Assembly has no if. Instead, instructions like cmp and test set flags, and the next instruction jumps or not depending on them. The flag we care obut most is the Zero Flag (ZF), it is set to 1 when a result was zero.
cmp  DWORD PTR [rbp-0x4], 0x2   ; compute argc - 2, set flags, throw away the result
je   0x11c1                     ; jump if equal (ZF = 1)

test eax, eax                   ; compute eax AND eax: ZF = 1 only if eax is 0
jne  somewhere                  ; jump if not equal (ZF = 0)
The whole control flow of a program is build from a few such instructions
| Instruction | Meaning |
jmp addr |
Always jumo (a plain GOTO) |
je / jz |
Jump if equal / if zero (ZF = 1) |
jne / jnz |
Jump if not equal / not zero (ZF = 0) |
call addr |
Push the address of the next instruction onto the stack, then jump to the function |
ret |
Pop that saved address from the stack and jump back to it |
Look closely at call and ret. The way back from every function is an address stored on the stack. If a buffer overflow overwrites it, ret will happily jump wherever we tell it to. That's the core idea behind stack exploitation.
Talking to the operating system
A program asks the Linux kernel for services (print text, exit, open files) through system calls. Put the call number and arguments into specific registers, then trigger the kernel.
; 64-bit Linux: write(1, msg, 4) then exit(0)
mov rax, 1        ; syscall number for write
mov rdi, 1        ; arg 1: file descriptor 1 = stdout
mov rsi, msg      ; arg 2: address of the text
mov rdx, 4        ; arg 3: length
syscall

mov rax, 60       ; syscall number for exit
mov rdi, 0        ; exit code
syscall
Older 32-bit code you'll find in many tutorials uses int 0x80 to call the kernel instead, with the number in EAX and arguments in EBX, ECX, EDX (and the numbers differ: write is 4, exit is 1).
It's the same recipe nut 32-bit Linux puts the values in different regisers (not just the 32-bit halves of the 64-bit ones): EAX holds the syscall number (like RAX), and EBX, ECX, EDX hold the 1st, 2nd and 3rd argument (like RDI, RSI, RDX). The same write(1, msg, 4) in 32-bit looks like this:
; 32-bit Linux: write(1, msg, 4) then exit(0)
mov eax, 4        ; syscall number for write (1 in 64-bit)
mov ebx, 1        ; arg 1: file descriptor 1 = stdout
mov ecx, msg      ; arg 2: address of the text
mov edx, 4        ; arg 3: length
int 0x80          ; call the kernel

mov eax, 1        ; syscall number for exit (60 in 64-bit)
mov ebx, 0        ; exit code
int 0x80
GDB: your microscope
GDB (GNU Debugger) lets you pause the running program, look at its registers and memory, step through it one instruction at a time, and even change values while it runs. It works on compiled binaries, so you can use it on programs you don't have the source code for.
First make GDB show assembly in the more readable intel syntax (you can put this line in ~/.gdbinit so it's always on):
set disassembly-flavor intel
Running and stopping
| Command | What it does |
run / r [args] |
Start the program, optionally with arguments: r AAAAAA |
break *main / b *main |
Stop when main starts |
break *0x55555555551a5 |
Stop at an exact intruction address |
info breakpoints |
List all breakpoints |
disable / enable / delete [n] |
Turn breakpoint n off, on or remove it |
continue / c |
Run until the next breakpoint |
quit / q |
Leave GDB |
Stepping
| Command | What it does |
next / n |
Next line of C code, stepping over function calls |
step / s |
Next line of C code, stepping into function calls |
nexti / ni |
Next assembly instruction, stepping over calls |
stepi / si |
Next assembly instruction, stepping into calls |
finish |
Run until the current function returns |
Looking around
| Command | What it does |
disassembly main |
Show the assembly of a function |
info registers / i r |
Show all registers. i r rip rsp rbp shows just those |
info frame |
Show the current stack frame, including the saved return address |
backtrace / bt |
Show the chain of function calls that led here |
print var / p $rax |
Print a variable or register |
x/16xb $rsp |
Examine memory: 16 bytes in hex, starting at the stack pointer |
x/4gx $rbp |
Examine 4 quad words (8 bytes each) in hex |
x/s |
Print memory as a string |
x/10i $rip |
Show the next 10 instructions |
list / l |
Show source code (only if compiled with -g) |
Changing things
| Command | What it does |
set $eax = 0 |
Change register value |
set var x = 5 |
Change a variable |
jump *0x5555555551c1 |
Continue execution at another address |
Tip: plain GDB is enough for this post. For exploit work, plugins like GEF pr pwndbg show registers, stack and code automatically after every step, which saves a lot of typing.
Lab 1: crashing a registration program
Time to break something. Here is a tiny "user registration" program. It takes a username from the command line, copies ot into a 16-byte buffer and greets the user.
// register_user.c
#include <stdio.h>
#include <string.h>

void register_user(char *input) {
    char username[16];          // room for 16 bytes

    strcpy(username, input);    // copies ALL of input, no length check

    printf("Welcome %s!\n", username);
}

int main(int argc, char *argv[]) {
    if (argc != 2) {
        printf("Usage: ./register_user <username>\n");
        return 1;
    }
    register_user(argv[1]);
    return 0;
}
The bug is on one line: strcpy() keeps copying until it reaches the end of the input string. It has no idea the destination only holds 16 bytes.
Compile it
gcc -g -O0 -Wall -fno-stack-protector -o register_user register_user.c| Flag | Why |
-g |
Include debug info, so GDB can show C source lines and variable names |
-O0 |
No optimization, so the assembly stays close to the C code |
-Wall |
Show all warnings |
-fno-stack-protector |
Turn of the stack canary, a protection that would detect the overflow and stop the program. We disable it to see the raw bug |
Run it
With a normal name, everything is fine:
./register_user tolga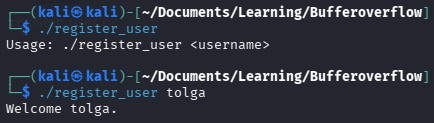
Now with a name that is too long:
./register_user AAAAAAAAAAAAAAAAAAAAAAA
A segmentation fault means the program tried to touch memory it is not allowed to accessm and the operating system killed it. Interesting, the welcome message still printed. So the crash doesn't happen inside register_user(), but later. Let's find out why
Look inside with GDB
gdb register_user
(gdb) set disassembly-flavor intel
(gdb) disassemble main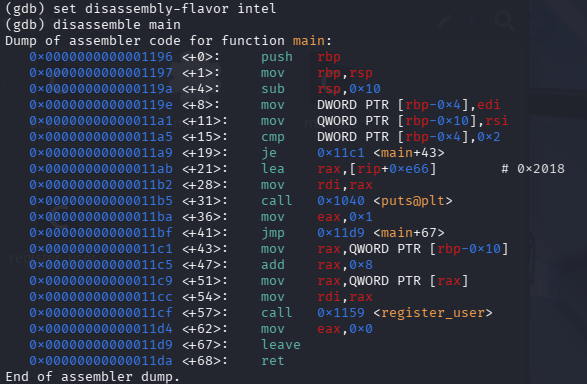
A few thing worth noticing:
[rbp-0x4]and[rbp-0x10]: main finds its own local variables relative to RBP. Remember this is the key to the crash.add rax, 0x8moves fromargv[0]toargv[1]. Each pointer is 8 bytes, so the next one is 8 bytes further. It changes the address, not the data- The C code calls
prinf("Usage ...\n"), but the assembly calls puts. The compiler swapped ot because a plain string ending in\ndoens't need printf' formatting.
Step through it
(gdb) break main
(gdb) run tolga
(gdb) info registers rip
RIP now points at the first instruction of main. Type ni (next instruction) a few times and run info registers rip again. RIP moves forward with every instruction. Use ni rather than si here, otherwise you'd dive into the internals of puts and strcpy.
Watch it crash
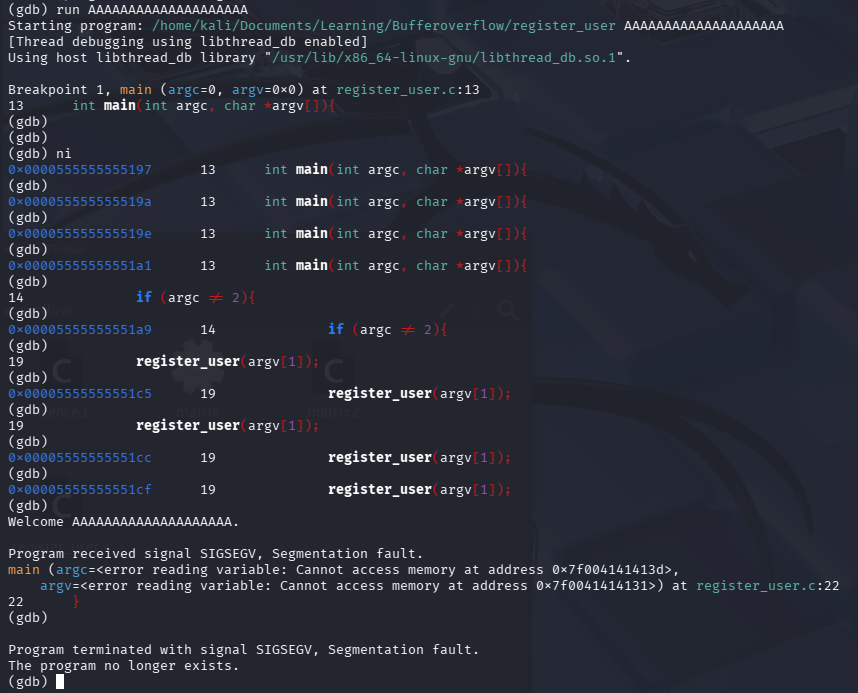
Look at those addresses. 0x41 is the ASCII code of A. Our input has ended up inside an address the program uses. Here's how:
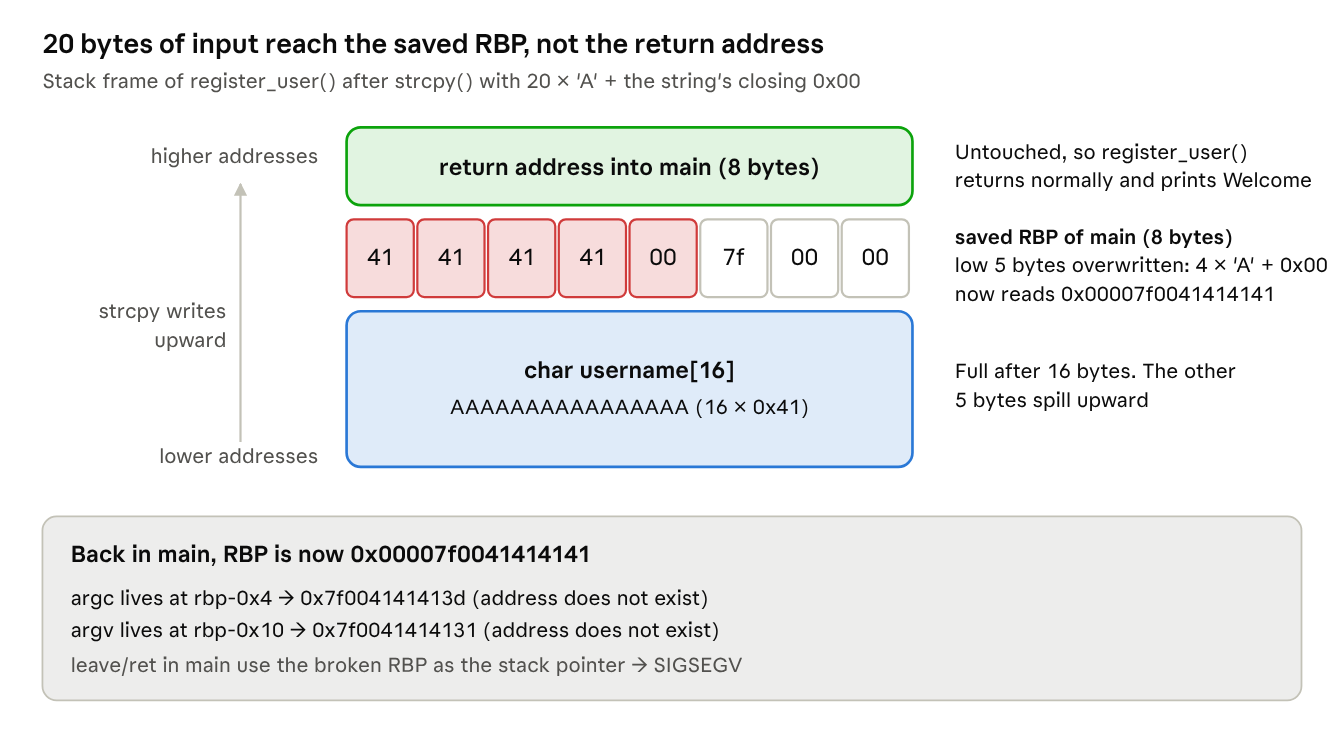
strcpy()fills the 16 bytes ofusername, then keeps going upward into the next 8 bytes: the saved RBP of main.- The return address sits above that and stays inctact, so
register_user()returns normally and the greeting is printed. - While returning, the corrupted value is loaded back into RBP. Main now looks for
argcatrbp-0x4andargvatrbp-0x10, which are exactly the two addresses in the error message. - Main's
leave/retuse the broken RBP as the stack, and the program crashes.
This is the important lesson: a few more As (24 and up) would have reached the return address itself. Then ret would jump to an address we wrote. That is how a crash becomes control over the program, and it's the topic of the next post.
Lab 2: cracking the safe
Now let's use the same tools to change what a program decides. This little program guards a safe. Give the right password and you get the money. Give the wrong one and the cops are on their way.
// safe.c
#include <stdio.h>
#include <string.h>

int main(int argc, char *argv[]) {
    if (argc == 2) {
        printf("Checking the password!\n");
        if (strcmp(argv[1], "1337") == 0) {
            printf("Access Granted.\n");
        } else {
            printf("Cops are coming!\n");
        }
    } else {
        printf("Usage: ./safe <password>\n");
    }
    return 0;
}
$ gcc -g -O0 -o safe safe.c
$ ./safe wrong-pass
Checking the password!
Cops are coming!Yes, the password is right there in the source. Pretend you only have the binary. Out goal: reach "Access Granted" without knowing the password.
Find the decision
Open it in GDB and disassemble main. You don't need to understand every line. Look for the landmarks: the cmp against 2, the calls to puts, the call to strcmp. Shortend, the interesting part looks like this:
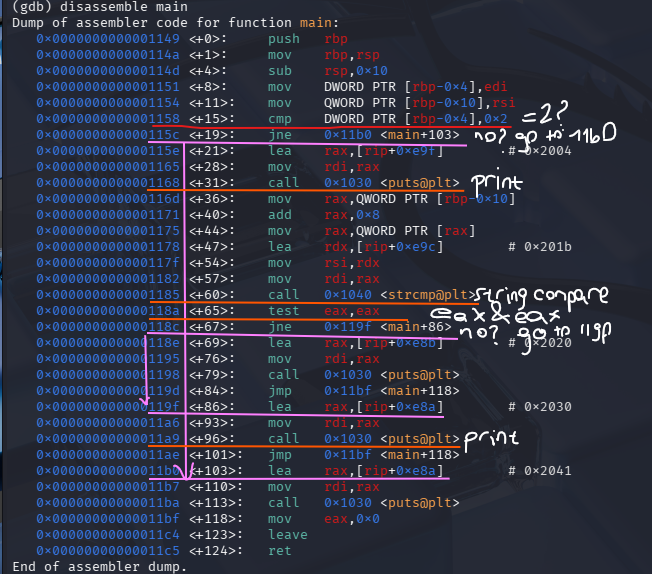
Here is ther better one:
cmp    DWORD PTR [rbp-0x4],0x2     ; argc == 2 ?
jne    <usage>                     ; no → print the usage text
...
call   <puts@plt>                  ; "Checking the password!"
...
call   <strcmp@plt>                ; compare argv[1] with "1337"
test   eax,eax                     ; ← the decision
jne    <cops>                      ; eax != 0 → "Cops are coming!"
...
call   <puts@plt>                  ; "Access Granted."
strcmp() returns 0 when both strings are equal and something else when they differ. That result comes back in EAX (the lower half of RAX, see section 3).
test eax, eax computes eax AND eax and throws the result away. It only sets the flags. Since x AND x is x, the Zero Flag ends up 1 only when EAX is 0. It also updates the Sign and Parity flags and clears the Carry and Overflow flags, but ZF is the one the jump looks at.
I find it helps to draw the flow before touching anything:
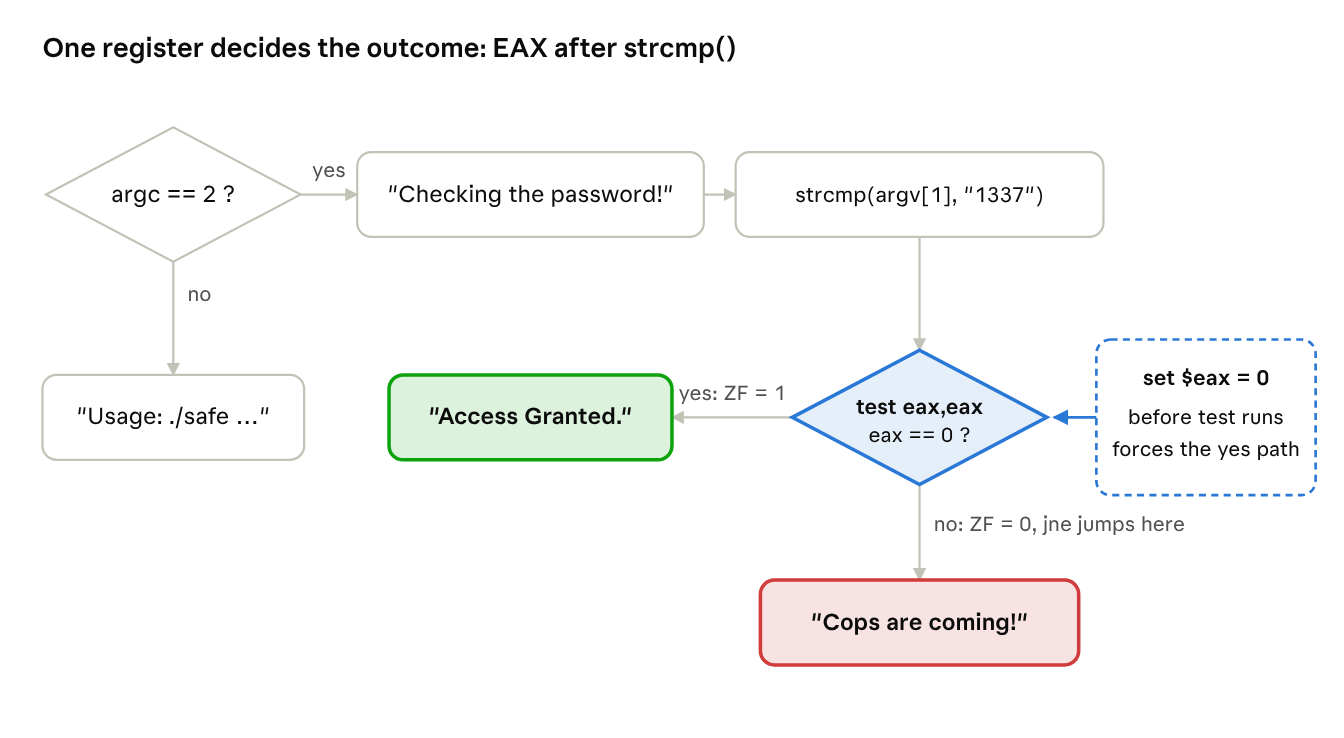
The whole security of this program depends on one register at one moment. If EAX is 0 when test runs, the program belives the password was right.
Crack it
- Stop at the start of main and run with a wrong password. The program is loaded now so the disassembly show real addresses.
(gdb) break main (gdb) run wrong-pass (gdb) disassemble main - Find the address of test eax, eax in the listing and put a breakpoint exactly there. In my run it was
0x55555555518ayours my differ. (Tip: select the address in the terminal and middle-click to paste it.)
(gdb) break *0x55555555518a (gdb) continue Checking the password! - Check what
strcmp()returned
Not zero, so the strings differ. (Fun detail: 0x46 is exactly(gdb) info registers rax rax 0x46 70'w' - '1', the difference between the first characters ofwrong-passand1337.)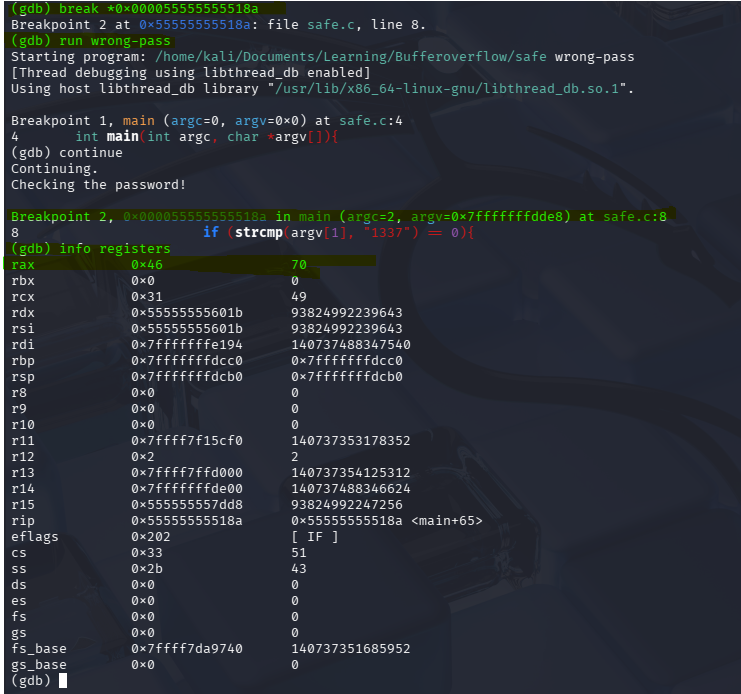
- Overwrite the result and let the program continue:
(gdb) set $eax = 0
(gdb) continue
Continuing.
Access Granted.
[Inferior 1 (process ...) exited normally]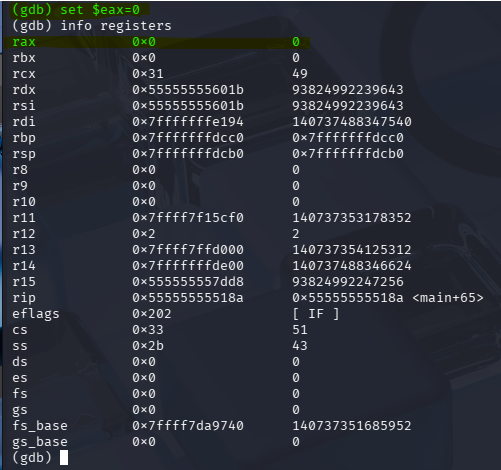
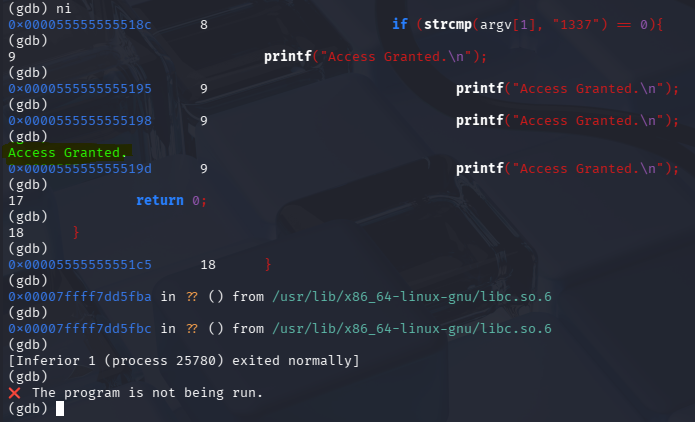
The safe is open. We didn't guess the password, we changed the program's answer to the question "was it correct?"
In real life you can't attach a debugger to someone else's server, but the same idea applies wherever an attacker controls the machine the check runs on: licence chacks, game anti-cheat, client-side validation. The lesson for developers: a check that runs on a machine the attacker controls can be bypassed.
What's next
In Lab 1 the overflow stopped just short of the return address. In the next post we'll go further: measure the exact distance to the return address, overwrite it on purpose, and redirect the program to code it was never meant to run.
We'll also meet the protections modern systems use against exactly this, and which we switched off or ignored today:
- Stack canaries: a secret value placed before the return address. If it changes, the program aborts. (
-fno-stack-protectorturned this off.) - NX/DEP: memory regions like the stack are marked as data, not code, so injected shellcode can't simply run there.
- ASLR: addresses change on every run, so an attacker can't hard-code where things are.
- Safe functions:
strncpy(),snprintf()andfgets()take a size limit. Even better: always check input length before copying.
If you are following along, try running Lab 1 with 24, 28 and 32 As and use info frame and x/4gx $rbp before register_user() return. Watch which bytes change. See you in the next post.